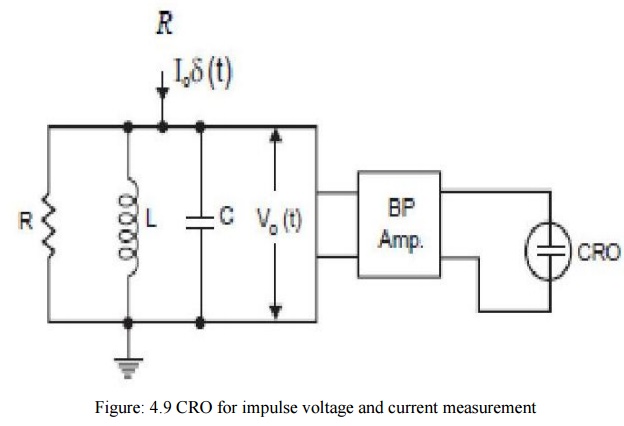
The coupling impedance Zm is a parallel combination of R, L and C whose quality factor is low. The complex impedance Zm is given as


The measuring impedance Zm is the impedance of a band pass filter which suppresses harmonic currents depending upon the selected circuit quality factor Q, below and above the resonance frequency f0 i.e., Zm will suppress all frequency currents below and above its resonance frequency. The alternate is– 20 dB per decade if Q = 1 and can be greatly increased.
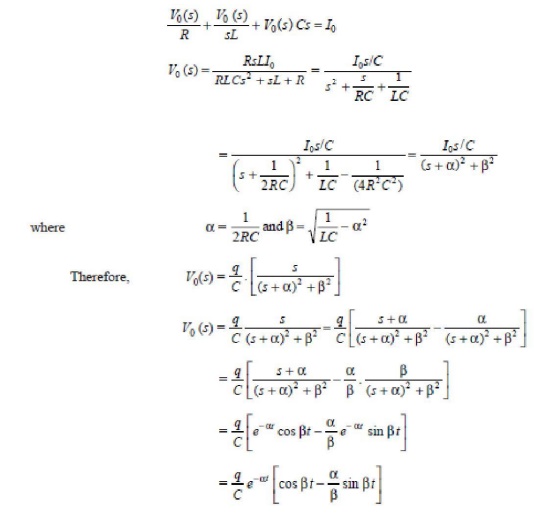
Also, the measuring circuit Zm performs integration of the PD pulse currents i (t) = I0 δ (t).The above equation shows a damped oscillatory output voltage where amplitude is proportional to the charge q. The charge due to the pulse i(t) is actually stored by the capacitor C instantaneously but due to the presence of inductance and resistance, Oscillations are produced. If these oscillations are not damped, the resolution time of the filter will be large and proper integration will not take place especiallyof the subsequent current pulses. There is a possibility of over lapping and the results obtainedwill be erroneous. The resolution time as is said earlier should be smaller than the time constant τ of thecurrent pulse [i (t) I0e-t/τ].The resolution time or decay time depends upon the Q-factor and resonancefrequency f0 of the measuring impedance Zm. Let Q = 1 = R/ LC . The voltage v0(t) as shown in Fig. 6.28 can be obtained by writing nodal equation.

The resolution time is about 10 μ sec and for higher values of Q, T will be still larger. The resonance frequency is also affected by the coupling capacitance Ck and the capacitance Ct of the test specimen as these contribute to the formation of C. Therefore, the R L C circuit should be chosen or selected according to the test specimen so that a desired resonance frequency is obtained. The desired central frequency f0 or a band width around f0 is decided by the band pass amplifier connected to this resonant circuit
These amplifiers are designed for typically lower and upper cut off frequencies (– 3 dB) between 150 kHz and 100 kHz. This band of frequency is chosen as it is much higher than thepower supply frequency and also the frequency which are not used by broadcasting stations.
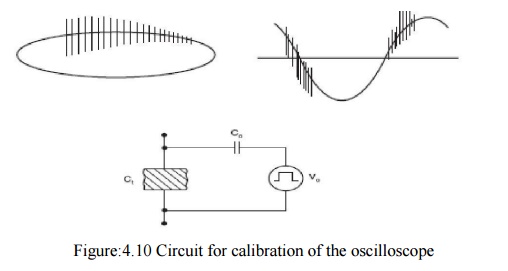
There solution time becomes less than 10 μ sec. and hence proper integration of the current pulse is made possible. However, the main job of the amplifier is to increase the sensitivity of the whole measuring system. The time dependency of the output voltage v0 (t) can be seen on the oscilloscope. In the usual ellipse representation, the individual pulse v0 (t) are practically only recognizable on vertical lines of different heights as one rotation of the ellipse corresponds to one period of the supply system 20 m sec. for 50 Hz and 16.7 m sec. for 60 Hz supplies.
The magnitude of the individual discharge is quantified by comparing the pulse crest value with the one obtained from the calibration circuit as shown in Fig. 6.30. The calibration circuit consists of a voltage step generator V0 and a series capacitor C0. The charge q is simulated with no normal voltage applied to the PD testing circuit. It is possible to suggest the location of the partial discharges in an insulating material by looking at the display on the CRO screen.


