CIRCLE DIAGRAMS
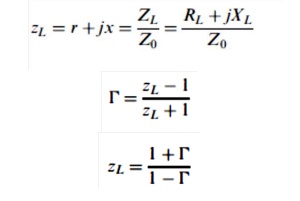
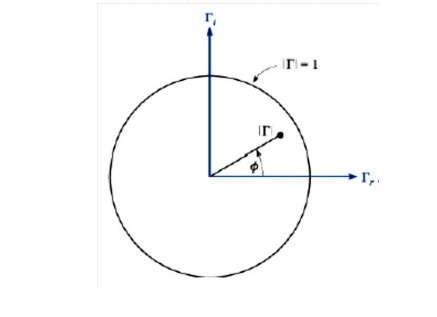
Transmission line problems often involve manipulations with complex numbers, making the time and effort required for a solution several times greater than that needed for a similar sequence of operations on real numbers. One means of reducing the labor without seriously affecting the accuracy is by using transmission-line charts. Probably the most widely used one is the Smith chart. Basically, this diagram shows curves of constant resistance and constant reactance; these may represent either an input impedance or a load impedance. The latter, of course, is the input impedance of a zero-length line. An indication of location along the line is also provided, usually in terms of the fraction of a wavelength from a voltage maximum or minimum. Although they are not specifically shown on the chart, the standing-wave ratio and the magnitude and angle of the reflection coefficient are very quickly determined. As a matter of fact, the diagram is constructed within a circle of unit radius, using polar coor- dinates, The basic relationshipupon which the chart is constructed is

The impedances which we plot on the chart will be normalized with respect to the characteristic impedance. Let us identify the normalized load impedance as zL